Forex Report 31/01/2022
Forex Currencies Report 31/01/2022
EURUSD
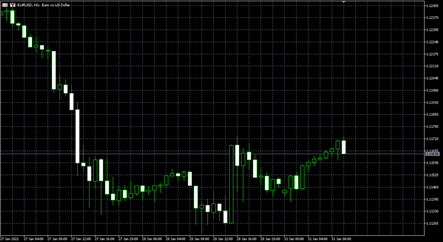
The dollar held most of last week's gains on Monday but hung just off 18-month highs against major currencies as ebbing market turbulence took some of the bid out of safe-haven assets. The EURUSD is looking to go into the weekend with the bearish bias intact. Looking at the chart, the pair fell below the low from 2021 (from November) during Thursday's trade at 1.11853. The corrective moves off the low today at 1.1207 could only extend to a high of 1.1173 before rotating back to the downside. The current price trades at 1.11413.
EURUSD
US Dollar Index
The dollar index, which measures the greenback against six major peers was at 97.205, just below Friday’s 18-month top of 97.441. While Fed Chairman Jerome Powell threw fuel on the fire on Jan. 26, it’s no surprise that the USD Index has rallied to new highs. For example, while dollar bears feasted on false narratives in 2021, I was a lonely bull forecasting higher index values. Likewise, after more doubts emerged in 2022, the death of the dollar narrative resurfaced once again.
USDJPY backs off
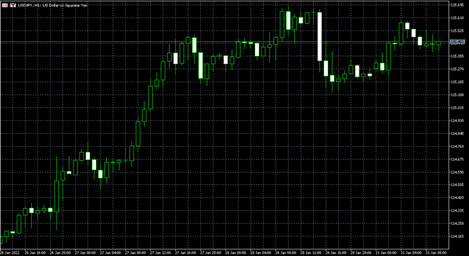
The USDJPY moved higher in the Asian session, and then into the London session, but ran into the next upside target area between 115.616 and 115.671. The high price reached 115.681 and started to find more selling interest. The price has backed off after the US data today giving the sellers some relief. The fall from the high moved down toward 115.241. That level is the 61.8% retracement of the January 2022 trading range. That level held support and the price is currently trading at 115.43.
USDJPY
GBPUSD higher
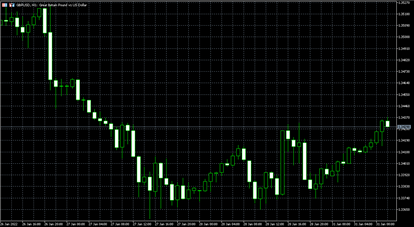
GBPUSD this week fell below the 100-day MA on Monday and stayed below on Tuesday and Wednesday. Yesterday the price continued the move lower and pushed below the 50% midpoint of the move up from 2021 low reached in November at 1.34533 (see daily chart above). The pairs low yesterday reached 1.33574. That was 5 pips off the low of a swing area between 1.33524 and 1.33757. Today the low was also in that swing area, but above the low from yesterday at 1.33645. The price has pushed higher. That is the good news for the dip buyers.
GBPUSD
AUDUSD
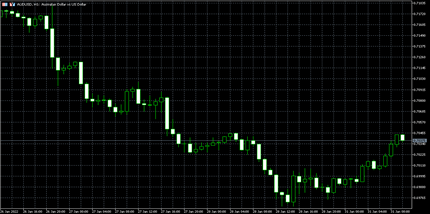
AUDUSD is probably the most-daunting chart out there, particularly if you're bullish on the outlook for global growth and the risk trade. On Friday it fell to the lowest since July 2020, breaking two major lows and the neckline of a head-and-shoulders pattern. That break targets levels below the bottom of this chart: Today though, the bulls are making a bit of a stand. AUD/USD is up 25 pips to 0.7011 which looks like a stay of execution on that chart more than a real bounce, at least for now. There's reason for hope though, especially with the rally in US equities late on Friday and the peace at least so far in Ukraine. The pair is also oversold by almost any metric so there's some scope for a bounce here.
AUDUSD
NZDUSD down
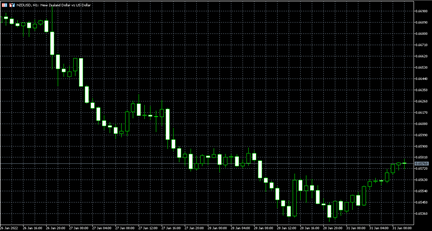
The NZDUSD is working on the 7th consecutive day to the downside and 9 of the last 11 days. The close from yesterday was at 0.6594. The current price is at 0.6546 so notching the 7th day lower is looking good. Since the high on January 13, the price has moved 361 pips to the downside in 11 trading days. Looking at the daily chart, the price is entered an area where a few swing lows and swing highs were made between June 2020 and November 2020 (the last time the price was this low). That area comes between 0.6488 and 0.6588. The low price today reached 0.6532 - between those extremes. If there is to be some dip buying, this area should give traders some cause for pause. However, apart from buying closer to 0.6488, I would need a little more confidence from shorter-term technicals.
NZDUSD
Stock To Watch as Earnings Season Begins
Earnings Next Week 31st January – 4th of February
| Monday, January 31, 2022 | ||||
| Country | Stock | EPS Forecast | Revenue Forecast | Market Cap. |
| US | NXP | 3.01 | 3B | 52.38B |
| US | Alexandria RE | 0.5314 | 547.87M | 30.31B |
| UK | Ryanair | -0.0797 | 1.51B | 16.33B |
| US | Tata Motors ADR | 0.2364 | 10.02B | 12.71B |
| US | Credit Acceptance | 12.69 | 459.36M | 8.04B |
| US | AGNC Invest | 0.6771 | 292.55M | 7.81B |
| US | Woodward | 0.815 | 595.16M | 6.90B |
| US | Affiliated Managers | 5.81 | 626.11M | 5.73B |
| Tuesday, February 1, 2022 | ||||
| Country | Stock | EPS Forecast | Revenue Forecast | Market Cap. |
| US | Alphabet C | 27.7 | 72.08B | 1.72T |
| US | Exxon Mobil | 1.89 | 85.01B | 314.00B |
| US | PayPal Holdings Inc | 1.12 | 6.9B | 184.44B |
| US | United Parcel Service | 3.09 | 27.05B | 172.96B |
| US | AMD | 0.7599 | 4.52B | 133.69B |
| US | Starbucks | 0.7968 | 8B | 112.13B |
| US | Gilead | 1.55 | 6.53B | 84.47B |
| US | Chubb | 3.29 | 8.87B | 83.63B |
| US | General Motors | 1.09 | 35.12B | 76.00B |
| US | Electronic Arts | 3.21 | 2.66B | 36.76B |
| US | Equity Residential | 0.2497 | 633.9M | 33.90B |
| US | Match Group | 0.5878 | 820.11M | 31.19B |
| US | Stanley Black Decker | 2.05 | 4.47B | 28.54B |
| US | Sirius XM | 0.0703 | 2.24B | 23.92B |
| US | PerkinElmer | 2.2 | 1.29B | 21.01B |
| IT | CNH Industrial NV | 0.2068 | 7.81B | 20.56B |
| US | Waters | 3.49 | 820.83M | 18.83B |
| US | Broadridge | 0.8243 | 1.2B | 17.80B |
| US | Catalent Inc | 0.8343 | 1.15B | 16.79B |
| US | IDEX | 1.58 | 708.48M | 16.10B |
| US | Franklin Resources | 0.8843 | 1.63B | 15.95B |
| US | Bio-Techne | 1.79 | 266.44M | 14.30B |
| US | PulteGroup | 2.31 | 4.2B | 12.93B |
| US | Pentair | 0.8524 | 943.47M | 10.32B |
| US | Lennox | 2 | 955.35M | 10.07B |
| US | Amdocs | 1.18 | 1.1B | 9.26B |
| US | Scotts Miracle-Gro | -0.6669 | 568.83M | 8.19B |
| US | ManpowerGroup | 2.02 | 5.35B | 5.57B |
| US | Ashland Global | 0.8938 | 519.69M | 5.43B |
| US | Unum | 0.8491 | 2.99B | 5.37B |
| US | MicroStrategy | -1.53 | 133.2M | 3.76B |
| US | MDC | 2.49 | 1.54B | 3.32B |
| NL | Artisan Partners AM | 1.28 | 314.94M | 3.28B |
| US | Helmerich Payne | -0.4996 | 391.76M | 3.03B |
| US | O-I Glass | 0.3304 | 1.52B | 2.02B |
| US | Pitney Bowes | 0.108 | 962.98M | 1.02B |
| Wednesday, February 2, 2022 | ||||
| Country | Stock | EPS Forecast | Revenue Forecast | Market Cap. |
| US | Meta Platforms | 3.85 | 33.35B | 818.28B |
| US | Alibaba ADR | 16.32 | 248.86B | 307.34B |
| US | AbbVie | 3.27 | 14.92B | 237.27B |
| US | Thermo Fisher Scientific | 4.88 | 8.75B | 221.81B |
| US | Novo Nordisk ADR | 0.7135 | 5.77B | 213.48B |
| US | Qualcomm | 3 | 10.43B | 187.04B |
| US | T-Mobile US | 0.1277 | 21.06B | 130.18B |
| US | Waste Management | 1.26 | 4.62B | 61.89B |
| FR | Santander ADR | 0.1183 | 13.28B | 61.49B |
| US | Boston Scientific | 0.4386 | 3.11B | 61.33B |
| US | MetLife | 1.47 | 17.27B | 55.57B |
| US | Emerson | 0.9899 | 4.47B | 53.89B |
| US | Humana | 1.16 | 21.22B | 48.47B |
| UK | Vodafone Group ADR | -- | -- | 45.10B |
| US | Roper Technologies | 3.67 | 1.5B | 45.02B |
| US | Marathon Petroleum | 0.5662 | 21.85B | 43.69B |
| US | Cognizant A | 1.04 | 4.78B | 42.98B |
| US | Ferrari NV | 1.22 | 1.35B | 41.55B |
| US | Aflac | 1.26 | 5.24B | 41.12B |
| US | IDEXX Labs | 1.72 | 781.83M | 39.56B |
| US | McKesson | 5.41 | 66.44B | 37.71B |
| US | eBay | 0.9992 | 2.61B | 36.13B |
| US | Align | 2.77 | 1.02B | 36.06B |
| UK | Vodafone Group PLC | -- | 9,278M | 33.65B |
| US | Old Dominion Freight Line | 2.26 | 1.38B | 33.59B |
| US | AvalonBay | 0.9983 | 598.68M | 33.55B |
| US | Spotify Tech | -0.5114 | 2.65B | 33.48B |
| US | DR Horton | 2.79 | 6.68B | 30.58B |
| US | AmerisourceBergen | 2.57 | 59.58B | 27.17B |
| US | Mid-America Apartment | 0.85 | 459.71M | 23.59B |
| US | Essex Property | 1.08 | 368.34M | 22.09B |
| US | Royal Caribbean Cruises | -3.9 | 1.03B | 20.65B |
| US | CGI Inc | 1.15 | 2.47B | 19.60B |
| US | Hologic | 1.26 | 1.16B | 17.14B |
| US | Avery Dennison | 2.13 | 2.13B | 16.17B |
| US | Qorvo Inc | 2.76 | 1.11B | 14.73B |
| US | CH Robinson | 1.85 | 6.22B | 13.29B |
| US | Lincoln National | 1.92 | 4.71B | 12.58B |
| US | Fortune Brands | 1.29 | 1.92B | 12.49B |
| US | IAC/InterActiveCorp | -0.407 | 960.44M | 11.52B |
| US | Globe Life | 1.76 | 1.28B | 10.37B |
| US | UGI | 1.25 | 2.21B | 9.35B |
| US | Capri Holdings | 1.69 | 1.47B | 8.23B |
| US | Omega Healthcare | 0.48 | 235.11M | 7.36B |
| UK | Severn Trent | -- | -- | 7.24B |
| US | Royal Gold | 0.938 | 171.36M | 6.67B |
| US | NewYork Times | 0.345 | 579.21M | 6.30B |
| UK | Evercore | 4.49 | 871.99M | 5.23B |
| US | The Hanover Insurance | 2.47 | 1.2B | 4.78B |
| US | Spirit Aerosystems | -0.6458 | 1.08B | 4.55B |
| US | MaxLinear | 0.8375 | 244.75M | 4.49B |
| US | Veoneer | -0.7303 | 445.33M | 3.91B |
| US | Brinker | 0.5231 | 928.49M | 1.53B |
| US | Tupperware Brands | 0.5446 | 413.2M | 703.88M |
| Thursday, February 3, 2022 | ||||
| Country | Stock | EPS Forecast | Revenue Forecast | Market Cap. |
| US | Amazon.com | 3.73 | 137.8B | 1.41T |
| US | Eli Lilly | 2.43 | 7.58B | 215.64B |
| US | Merck&Co | 1.54 | 13.13B | 199.90B |
| NL | Royal Dutch Shell ADR | 1.4 | 70.34B | 196.12B |
| UK | Royal Dutch Shell B ADR | 1.4 | 70.34B | 196.12B |
| UK | Royal Dutch Shell B | 0.5159 | 51.62B | 146.33B |
| US | Honeywell | 2.08 | 8.74B | 138.13B |
| US | ConocoPhillips | 2.17 | 13.72B | 114.83B |
| US | Estee Lauder | 2.64 | 105.31B | |
| US | Ford Motor | 0.4298 | 41.23B | 79.57B |
| US | Cigna | 4.72 | 43.92B | 77.56B |
| US | Illinois Tool Works | 1.89 | 3.53B | 73.14B |
| US | Becton Dickinson | 2.85 | 4.76B | 72.37B |
| US | ICE | 1.32 | 1.83B | 68.82B |
| SE | ABB ADR | 0.392 | 7.46B | 68.16B |
| US | Activision Blizzard | 1.32 | 2.84B | 61.37B |
| FR | ING ADR | 0.3138 | 5.06B | 56.20B |
| US | Southern Copper | 1.14 | 2.56B | 49.95B |
| US | Snap | -0.093 | 1.2B | 46.09B |
| US | Fortinet | 1.15 | 960.23M | 44.33B |
| ES | BBVA ADR | 0.1637 | 5.78B | 42.59B |
| US | Prudential Financial | 2.36 | 14.55B | 42.25B |
| US | Microchip | 1.17 | 1.75B | 41.28B |
| US | Suncor Energy | 0.8237 | 8.73B | 40.59B |
| US | Parker-Hannifin | 3.91 | 3.71B | 40.34B |
| US | Hershey Co | 1.61 | 2.26B | 39.99B |
| US | DuPont De Nemours | 0.9939 | 4.03B | 39.76B |
| US | Motorola | 2.74 | 2.33B | 38.43B |
| US | Aptiv | 0.54 | 3.86B | 36.59B |
| US | Allstate | 2.76 | 10.07B | 34.49B |
| US | Corteva | 0.0918 | 3.46B | 33.54B |
| US | Cummins | 3.17 | 5.79B | 32.30B |
| US | Biogen | 3.34 | 2.62B | 32.28B |
| US | Ametek | 1.3 | 1.47B | 30.82B |
| UK | Compass | -- | 5.55B | 29.70B |
| US | WEC Energy | 0.6764 | 1.73B | 29.69B |
| US | Unity Software | -0.0681 | 294.66M | 29.08B |
| US | Fortive | 0.7788 | 1.44B | 24.97B |
| US | WW Grainger | 5.23 | 3.27B | 24.78B |
| US | Hartford | 1.52 | 5.13B | 23.90B |
| US | Skyworks | 3.1 | 1.5B | 23.49B |
| US | Clorox | 0.84 | 1.66B | 20.24B |
| US | Xylem | 0.6164 | 1.31B | 18.50B |
| US | CMS Energy | 0.4305 | 1.74B | 18.06B |
| US | Quest Diagnostics | 3.08 | 2.6B | 16.61B |
| US | Camden Property | 0.4792 | 304M | 16.05B |
| US | Check Point Software | 2.14 | 585.8M | 15.55B |
| US | NortonLifeLock Inc | 0.436 | 701.68M | 14.74B |
| US | Cardinal Health | 1.26 | 45.6B | 14.31B |
| US | News Corp | 0.2668 | 2.62B | 12.53B |
| US | News Corp A | 0.2668 | 2.62B | 12.42B |
| US | WestRock Co | 0.6357 | 4.95B | 11.41B |
| US | Snap-On | 3.61 | 1.1B | 11.17B |
| US | Arrow Electronics | 4.44 | 8.92B | 8.34B |
| US | Deckers Outdoor | 8.12 | 1.18B | 8.19B |
| US | Ralph Lauren A | 2.18 | 1.64B | 7.79B |
| US | Reinsurance of America | 0.8347 | 4.09B | 7.65B |
| US | Synaptics | 3.1 | 405.06M | 7.52B |
| US | Penn National Gaming | 0.5139 | 1.51B | 7.35B |
| US | Post | 0.4322 | 1.64B | 6.63B |
| US | Nov | -0.0285 | 1.46B | 6.46B |
| US | Ingredion | 1.34 | 1.75B | 6.27B |
| US | Hanesbrands | 0.437 | 1.75B | 5.44B |
| US | Mimecast Ltd | 0.3438 | 150.21M | 5.30B |
| US | Timken | 0.907 | 982.58M | 5.15B |
| US | CDK Global Holdings LLC | 0.64 | 434.6M | 4.95B |
| US | Exponent | 0.3467 | 100.37M | 4.87B |
| US | Maximus | 0.7825 | 1.1B | 4.67B |
| US | Walker&Dunlop | 2.27 | 347.7M | 4.10B |
| US | The Hain Celestial | 0.3403 | 482.11M | 3.31B |
| US | Werner | 0.9598 | 727.24M | 2.90B |
| DE | Minerals Technologies | 1.21 | 488.9M | 2.32B |
| US | GoPro Inc | 0.3518 | 382.31M | 1.32B |
| US | Triumph | 0.2087 | 371.34M | 1.21B |
| US | Apartment Invest | 0.00 | 204.37M | 1.03B |
| Friday, February 4, 2022 | ||||
| Country | Stock | EPS Forecast | Revenue Forecast | Market Cap. |
| US | Regeneron Pharma | 19.68 | 4.42B | 63.28B |
| US | Eaton | 1.72 | 4.91B | 63.07B |
| US | Air Products | 2.52 | 2.73B | 61.28B |
| US | Aon | 3.32 | 3.15B | 58.98B |
| US | Honda Motor ADR | 0.7581 | 31.96B | 49.09B |
| US | Cboe Global | 1.53 | 389.14M | 12.24B |
| US | DXC Technology | 0.9142 | 4.1B | 7.40B |
| US | AutoNation | 4.94 | 6.43B | 7.04B |
| US | Adient | -0.2556 | 3.25B | 4.09B |
| US | GrafTech | 0.4316 | 355M | 2.63B |
Dividends Next Week 31st January – 4th of February
| Monday, January 31, 2022 | |||||
| Country | Stock | Ex-Dividend Date | Dividend | Currency | Yield |
| US | Aon | 31/01/2022 | 0.51 | USD | 0.01 |
| US | Bank of Montreal | 31/01/2022 | 1.33 | USD | 0.04 |
| US | Caseys | 31/01/2022 | 0.35 | USD | 0.01 |
| US | Hasbro | 31/01/2022 | 0.68 | USD | 0.03 |
| US | NRG | 31/01/2022 | 0.35 | USD | 0.04 |
| US | People’s United | 31/01/2022 | 0.18 | USD | 0.04 |
| US | Pinnacle West | 31/01/2022 | 0.85 | USD | 0.05 |
| US | Realty Income | 31/01/2022 | 0.25 | USD | 0.04 |
| Tuesday, February 1, 2022 | |||||
| Country | Stock | Ex-Dividend Date | Dividend | Currency | Yield |
| US | Fastenal | 01/02/2022 | 0.31 | USD | 0.02 |
| Wednesday, February 2, 2022 | |||||
| Country | Stock | Ex-Dividend Date | Dividend | Currency | Yield |
| US | AptarGroup | 02/02/2022 | 0.38 | USD | 0.01 |
| US | KB Home | 02/02/2022 | 0.15 | USD | 0.01 |
| US | Valero Energy | 02/02/2022 | 0.98 | USD | 0.05 |
| Thursday, February 3, 2022 | |||||
| Country | Stock | Ex-Dividend Date | Dividend | Currency | Yield |
| US | American Campus | 03/02/2022 | 0.47 | USD | 0.04 |
| US | Costco | 03/02/2022 | 0.79 | USD | 0.01 |
| US | JB Hunt | 03/02/2022 | 0.40 | USD | 0.01 |
| US | Pacific Premier | 03/02/2022 | 0.33 | USD | 0.03 |
| Friday, February 4, 2022 | |||||
| Country | Stock | Ex-Dividend Date | Dividend | Currency | Yield |
| US | Citigroup | 04/02/2022 | 0.51 | USD | 0.03 |
| US | FirstEnergy | 04/02/2022 | 0.39 | USD | 0.04 |
| UK | PetMed Express | 04/02/2022 | 0.30 | GBP | 0.05 |

